
The banner reads “HOW AM I DANCING? CALL: 0800-…” — a party spin on the “How's my driving?” sticker on Brazilian trucks, and a fitting cover for a case about satisfaction surveys.
+15pp satisfaction in one quarter: how I redesigned the CSAT instrument to produce actionable data
How redesigning a CSAT instrument — a reworded question, a single-choice answer and categories broken down into two levels — removed ambiguity from the collected data and coincided with a +14.8 p.p. jump in overall satisfaction over four months, with an honest discussion of the instrument's bias and the limits of causality in the result.
Context: an omnichannel customer service product migrating from a legacy version (in production since 2018) to a new one. The user base resisted the change, which made it hard to tell "adaptation pain" apart from "real product problems".
Problem
The CSAT instrument in production collected two pieces of information: a satisfaction score (1-5) and an open question about the reason for the score ("What made you give this score?"), answered through subject categories (Features, Interface, Bugs, Usability, Time to complete actions, Filters).
The design of the second question had a flaw: the categories didn't indicate the direction of sentiment. A respondent who gave a 1 and selected "Interface" and another who gave a 5 and selected the same category produced the same raw data — the category only gained meaning when manually cross-referenced with the score, in a spreadsheet, in three languages (PT/EN/ES), with no automation.
How satisfied are you with this new version of the platform?
Interactive simulation of the full widget flow (via Hotjar) in the original version of the survey, showing how it appeared to respondents — feel free to answer, nothing is saved. Flow, copy and scale may have been adapted for presentation in this portfolio.
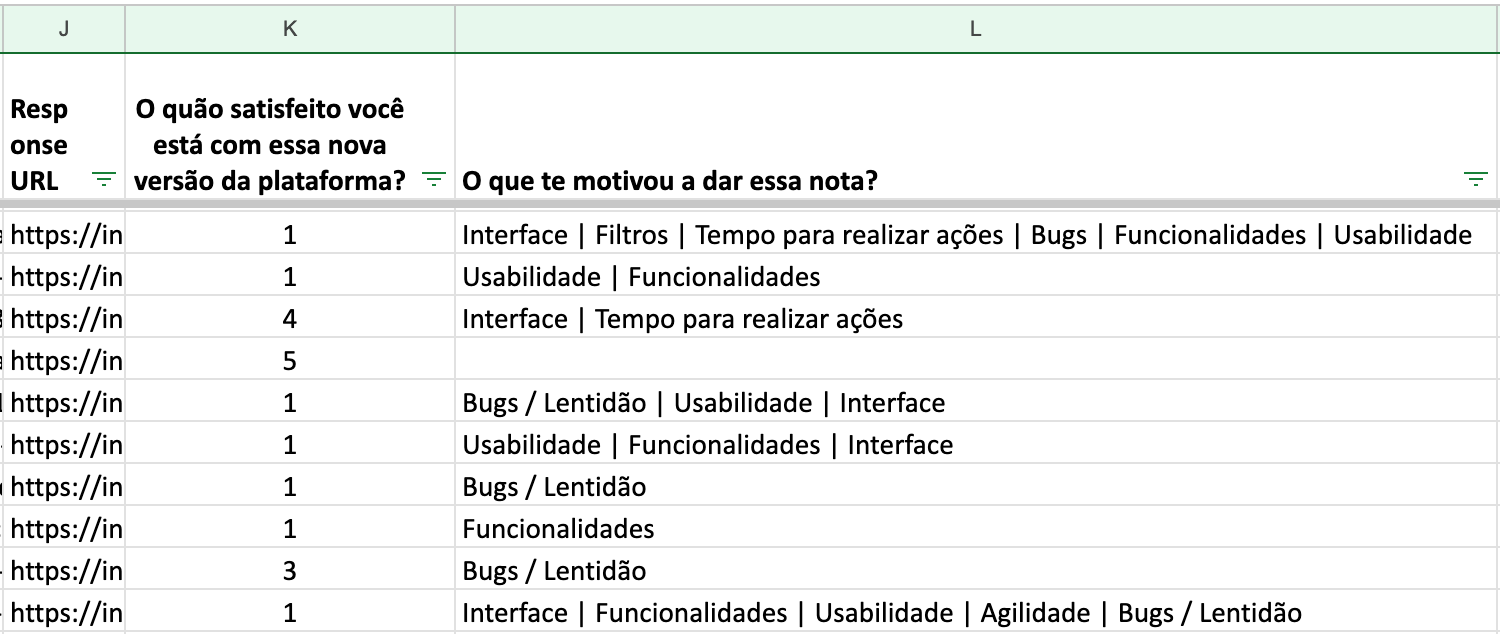
Raw export of the original survey. Column K: "How satisfied are you with this new version of the platform?" (1-5). Column L: "What made you give this score?", with several categories per answer — e.g. "Interface | Filters | Time to complete actions | Bugs | Features | Usability" or "Bugs / Slowness".
The analysis process was slow and unreliable: for example, of the 165 votes categorized as "Interface", manual segmentation revealed 100 detractors and 65 promoters — and the promoters' votes led to no action at all, since the category didn't say what specifically had worked well.

A single row from the same export: score 4, categories "Interface | Time to complete actions", comment "Great!!!". The same categories a detractor would pick — with the opposite meaning.
Diagnosis
Two design decisions were at the root of the problem:
- The question measured general perception, not the direction of improvement.
- The categories were broad enough to allow opposite interpretations, depending on the respondent's context.
Solution
Rewording the question. The motivational question was replaced with "What would you like us to improve?" — wording that steers every answer (from detractors and promoters alike) toward an improvement action, eliminating sentiment ambiguity at the source. The answer now accepted only one option, forcing respondents to prioritize their most relevant pain instead of listing several.
This choice carries an implication I want to acknowledge: the question assumes there is something to improve, which tends to inflate the share of problem-oriented answers, even among satisfied respondents. It's a deliberate trade-off — the instrument prioritizes capturing an action signal (what to do next) over measurement neutrality (how satisfied, on average, the audience is).
Two-level breakdown. Each level-1 category (topic) now opens a specific, contextual set of subtopics, so respondents never have to go back to previous steps. The vocabulary for topics and subtopics was defined from terms that recurred in existing feedback and support tickets, rather than technical terminology — for example, "bugs" was kept because it was already the word users used spontaneously, while "usability" became "being easier to use".
Final structure:
- Bug fixes → feature where it happens (sending messages, chat/history, quotes, booking registration, other)
- New features
- Speed of actions → slowest action (messages, opening the platform, quotes, booking registration, other)
- Being easier to use → type of difficulty (finding a specific conversation, complex features, missing information on screen, hard to find information in the conversation, other)
- Screen design → biggest problem (colors, spacing, too much information, other)
How satisfied are you with this new version of the platform?
Interactive simulation of the full reformulated survey script, where each topic answer unlocks a different set of subtopics — feel free to answer, nothing is saved. Flow, copy and scale may have been adapted for presentation in this portfolio.
Validation. The new instrument was validated internally with product and engineering leadership before launch; there was no formal test with end users beforehand — a conscious trade-off between launch speed and upfront validation rigor, with the real learning coming from data already in production.
Continuous discovery channel. An option to book a conversation about the feedback given was added at the end of the survey — reducing the team's effort to actively recruit interviewees.
Analysis automation. As operational support for the redesign, cross-referencing data was no longer manual either: a dashboard connecting Hotjar results to Metabase tables started automatically cross-referencing votes, subjects and the MRR of respondent accounts, replacing manual work across three spreadsheets with filters and a view of CSAT evolution by theme over time.
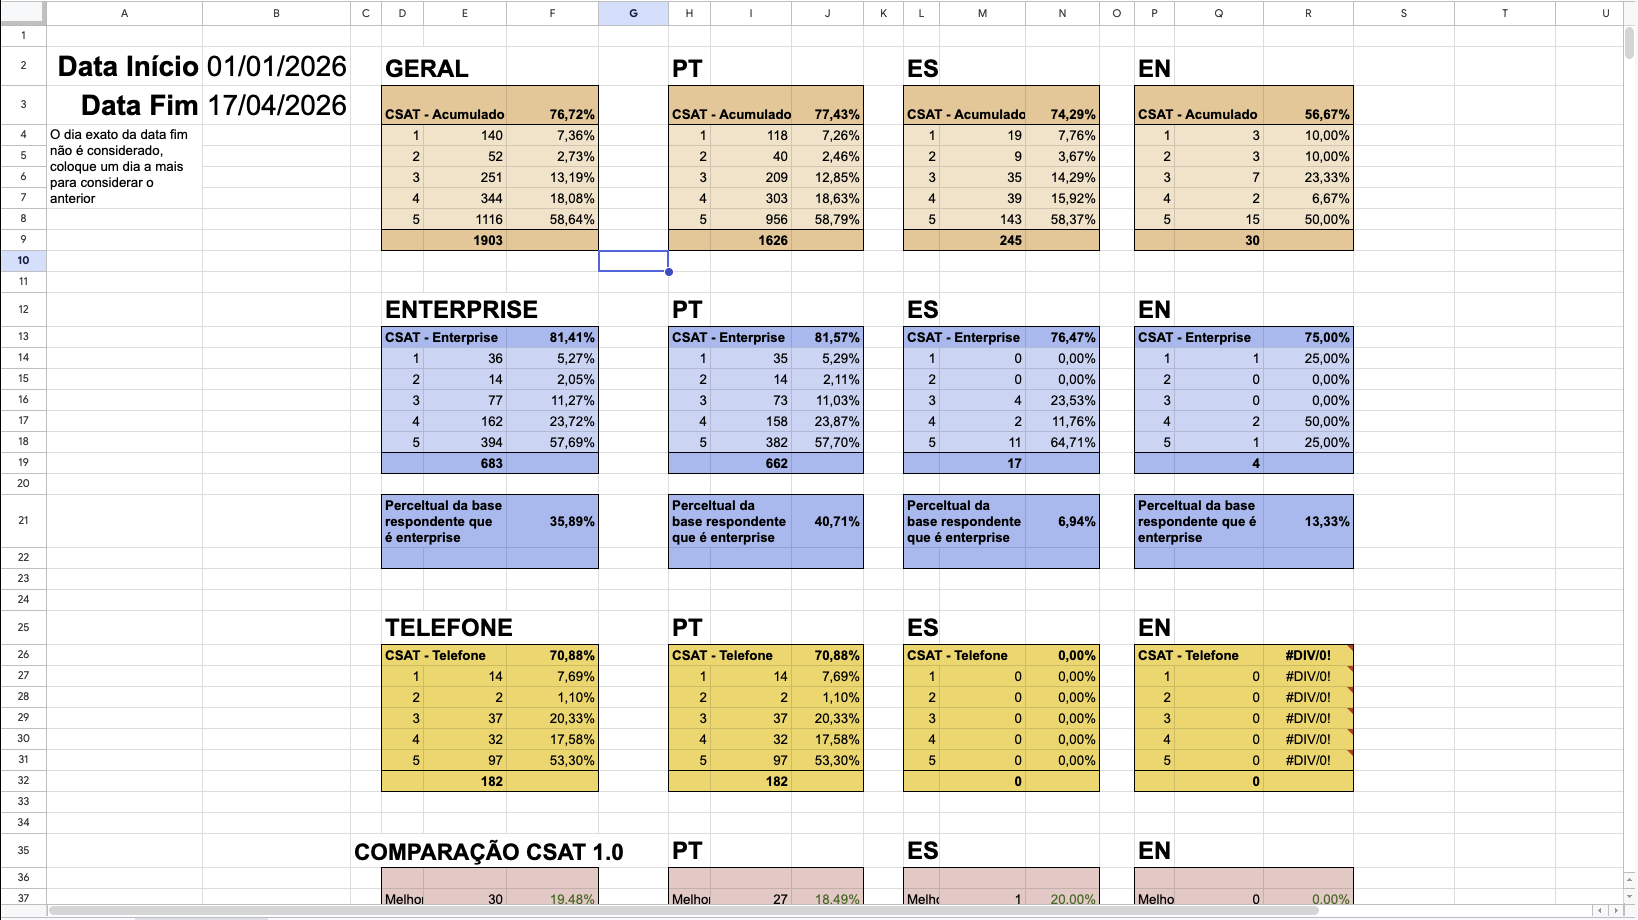
Analysis spreadsheet: accumulated CSAT by segment — Overall (Geral), Enterprise and Phone (Telefone) — split by language (PT / ES / EN), with the distribution of 1-5 scores for the selected start and end dates (Data Início / Data Fim) and the share of respondents from Enterprise accounts.
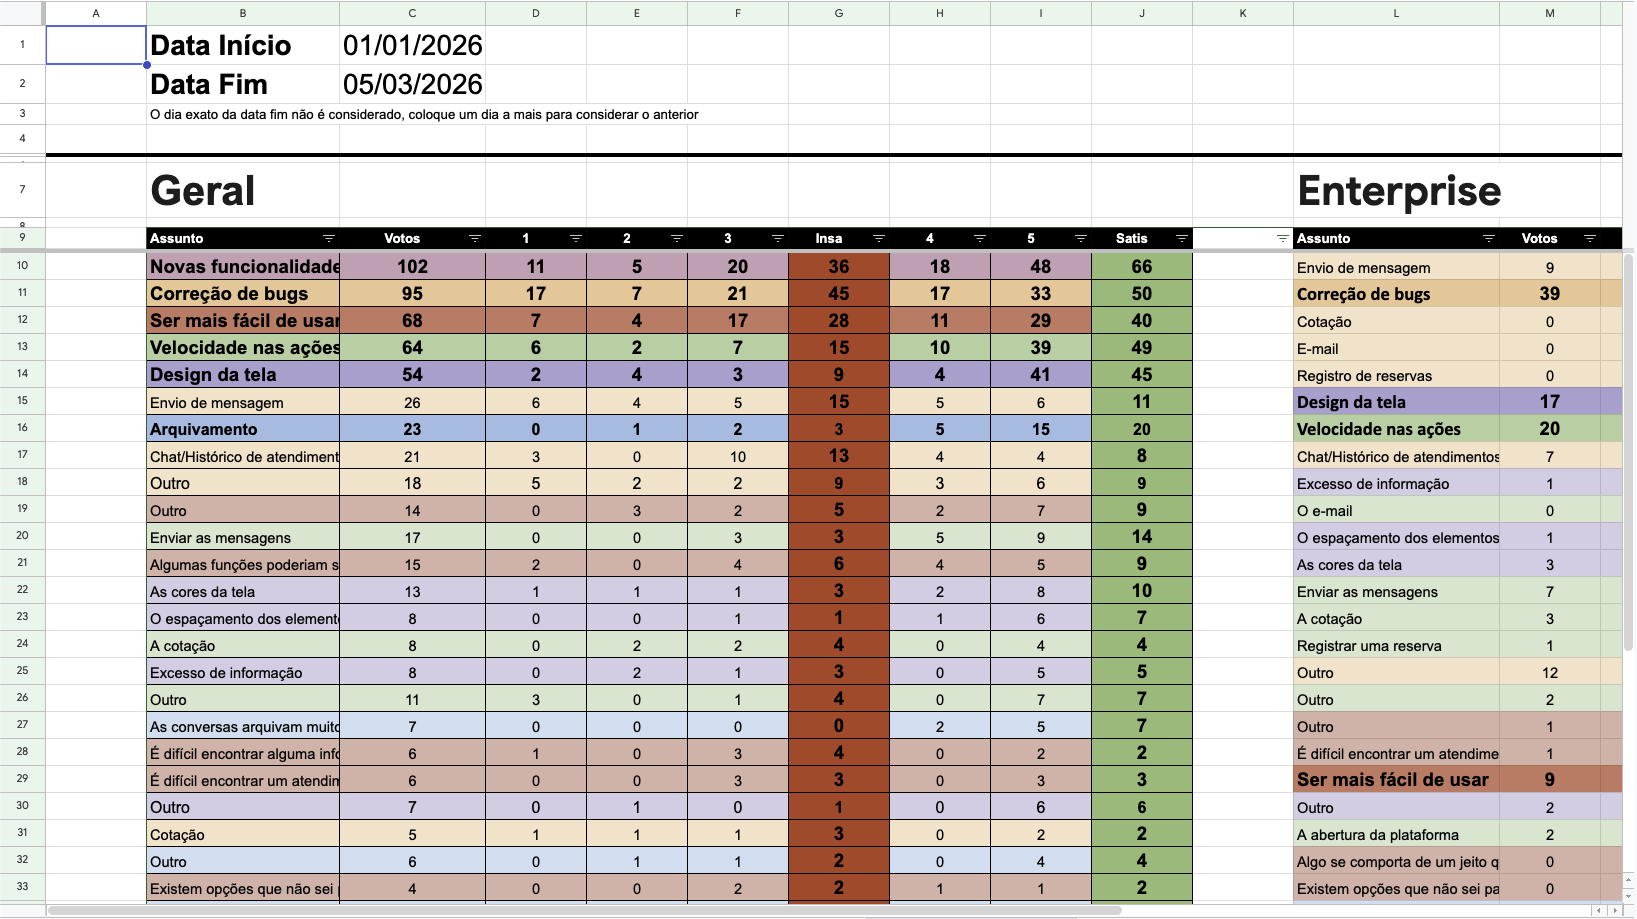
Votes per subject and subtopic (Assunto), split by score (1-5), dissatisfied (1-3, Insa) and satisfied (4-5, Satis) — overall on the left, Enterprise on the right. Top subjects in this window: New features (102), Bug fixes (95), Being easier to use (68), Speed of actions (64) and Screen design (54).
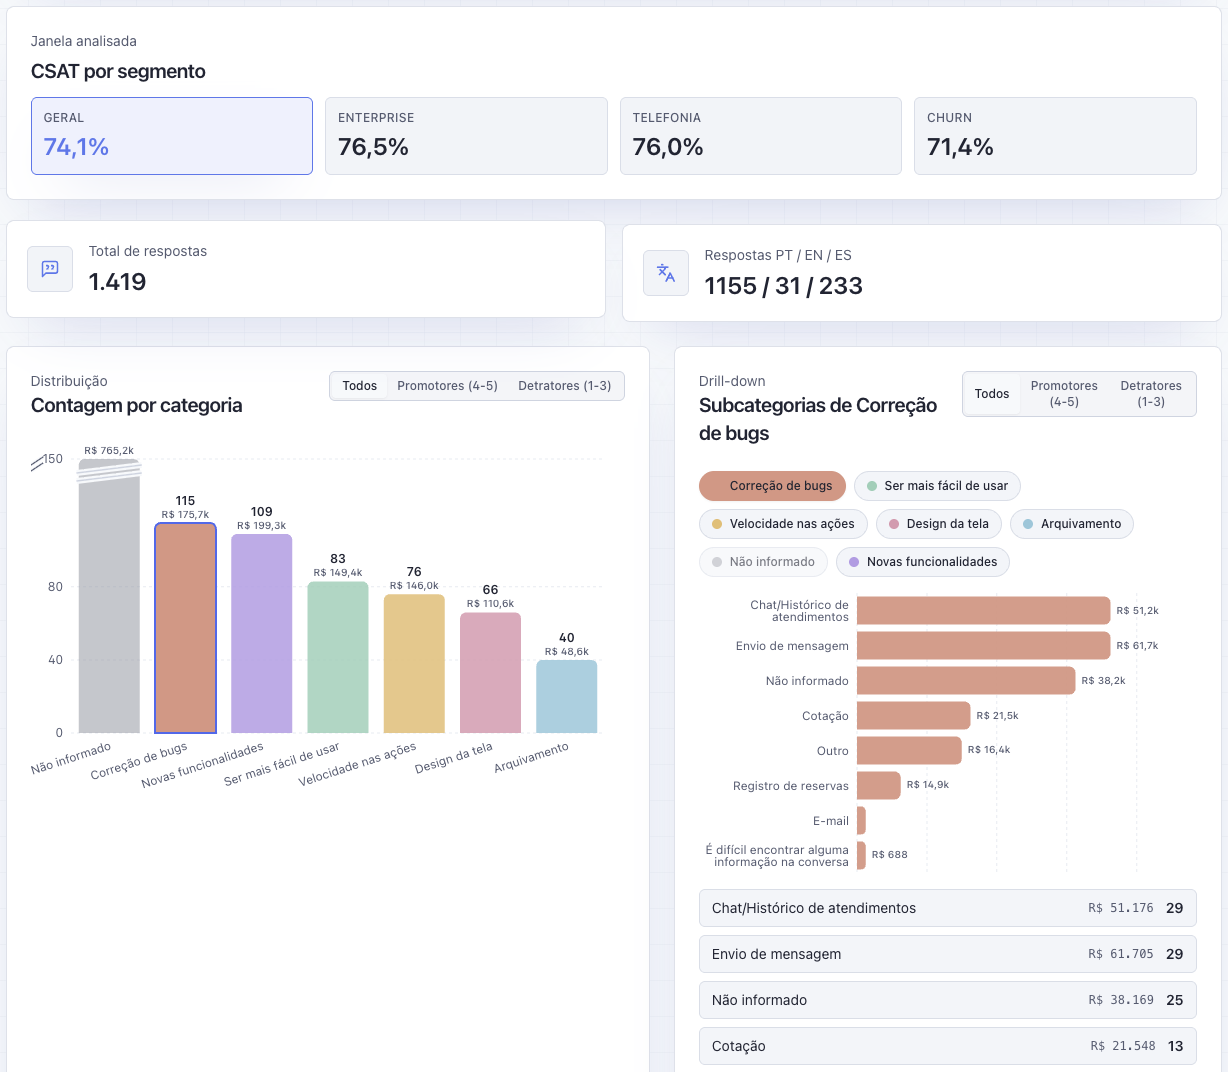
The dashboard: CSAT by segment (Overall, Enterprise, Phone and Churn), total responses and responses by language (PT / EN / ES), vote count per category with the MRR (R$) of respondent accounts, and a drill-down into the "Bug fixes" subcategories — all filterable by promoters (4-5) and detractors (1-3). Não informado means "Not provided".
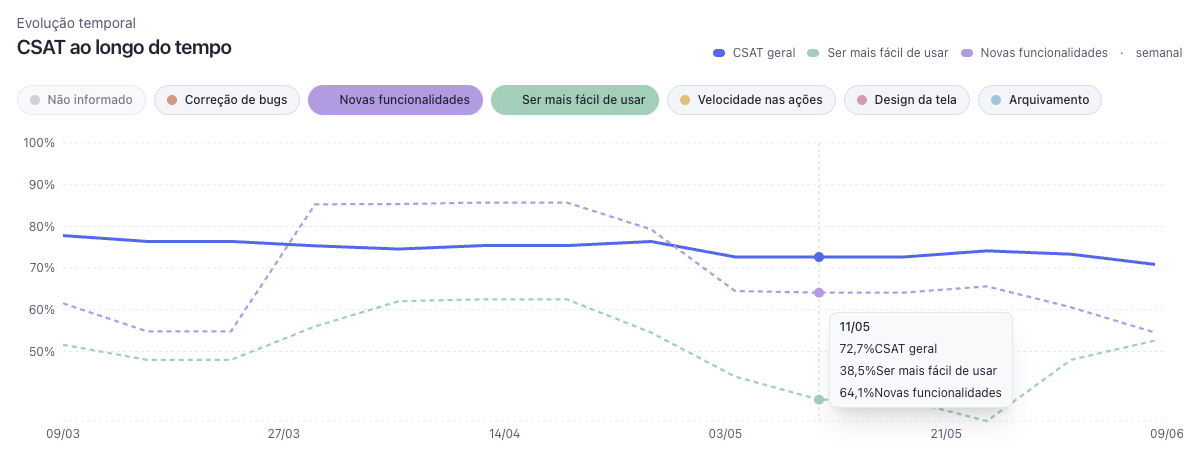
CSAT over time (weekly): overall CSAT (solid line) compared with the "Being easier to use" and "New features" topics (dashed lines). Any topic can be toggled on the chart.
Result
Monthly data on the % of satisfied respondents (score 4-5), taken from the tracking dashboard:
| Month | Overall CSAT (N) | Screen design (N) |
|---|---|---|
| 11/2024 | 61.6% | 51.8% |
| 12/2024 | 64.3% (395) | 44.6% (56) |
| 01/2025 | 62.7% (415) | 45.2% (42) |
| 02/2025 | 74.0% (500) | 59.4% (32) |
| 03/2025 | 76.4% (403) | 77.8% (18) |
Overall CSAT went from a 61-64% range (Nov/2024–Jan/2025) to 76.4% in Mar/2025 (+14.8 p.p.).
The "Screen design" subtopic — identified by the new structure as the main concentration of complaints within design — showed a sharper and more time-bound change: from 45.2% in Jan/2025 to 77.8% in Mar/2025 (+32.6 p.p.), a period that coincides with the general release of a dark mode for the interface, built in direct response to this insight (beta from 12/24/2024, general release on 01/30/2025).
In addition, the number of respondents who rated "Screen design" as their main pain dropped steadily over the same period (56 → 42 → 32 → 18), pointing to a twofold effect: higher satisfaction among those who still reported the problem, and fewer people for whom the problem was still relevant.
Corroboration from a second cut of the same data. The dark mode project, documented separately, measured the same event with a different unit of analysis — the ranking of subjects, not just the satisfaction percentage — and reached the same direction of result:
- In the month before the launch (Dec 1–Jan 1), "Screen design" was the most voted macro subject out of the 6 available (56 votes), and "the screen colors" was the 2nd most voted subtopic in the entire survey (17 votes).
- In the month after the launch (Mar 1–Apr 1), "Screen design" dropped to 5th place (18 votes), and "the screen colors" fell to last place among the most cited subtopics (3 votes).
- The Enterprise segment, measured separately, also improved in the same window: from 65.22% to 79.37% satisfaction.
A problem becoming the #1 complaint across the entire base and, two months later, collapsing to the bottom of the ranking is a signal that's harder to attribute to coincidence than an isolated percentage change. One methodological difference between the two sources is worth noting: the dark mode write-up uses a rolling 30-day window (Mar 1–Apr 1, 75.77%, N=421), while the data here uses the calendar month (03/2025, 76.4%, N=403) — the numbers are close but not identical, since they're different time cuts of the same base.
Limitations of the result: even so, the dark mode launch period overlaps with the window in which overall CSAT improved, which makes it impossible to statistically isolate the effect of the survey redesign from the effect of the product fix it pointed to — even with two independent cuts (percentage and ranking) pointing in the same direction, this remains converging evidence, not a controlled experiment. The most defensible reading is that of a closed discovery loop: the revised instrument correctly identified the priority pain, that pain was addressed, and the corresponding metric — from more than one measurement angle — was the one that moved the most. The March data point (N=18) should also be read with caution given the small sample size — the strongest evidence lies in the four-month trend and in the convergence between sources, not in a single data point.
Process learnings
- Instrument ambiguity produces noisy data even when response volume is high — the problem with v1 was never a lack of data, it was a lack of actionable data.
- A single-answer constraint (forcing prioritization) can be a decision of methodological rigor, not just an operational convenience for handling data.
- The "Other" option worked as an indirect indicator of how well the subtopics were designed: in the most concrete categories (bugs, design), "Other" had low uptake; in the most abstract one ("being easier to use"), "Other" was the second most chosen option — signaling that this particular set of subtopics still needs refinement.
- Acknowledging the bias of your own instrument (in this case, an intentional bias toward an action signal) is better than presenting it as neutral.